
This page is a collection of sea-ice products that are available from different sources on the internet.
Sea-ice concentration from University of Bremen
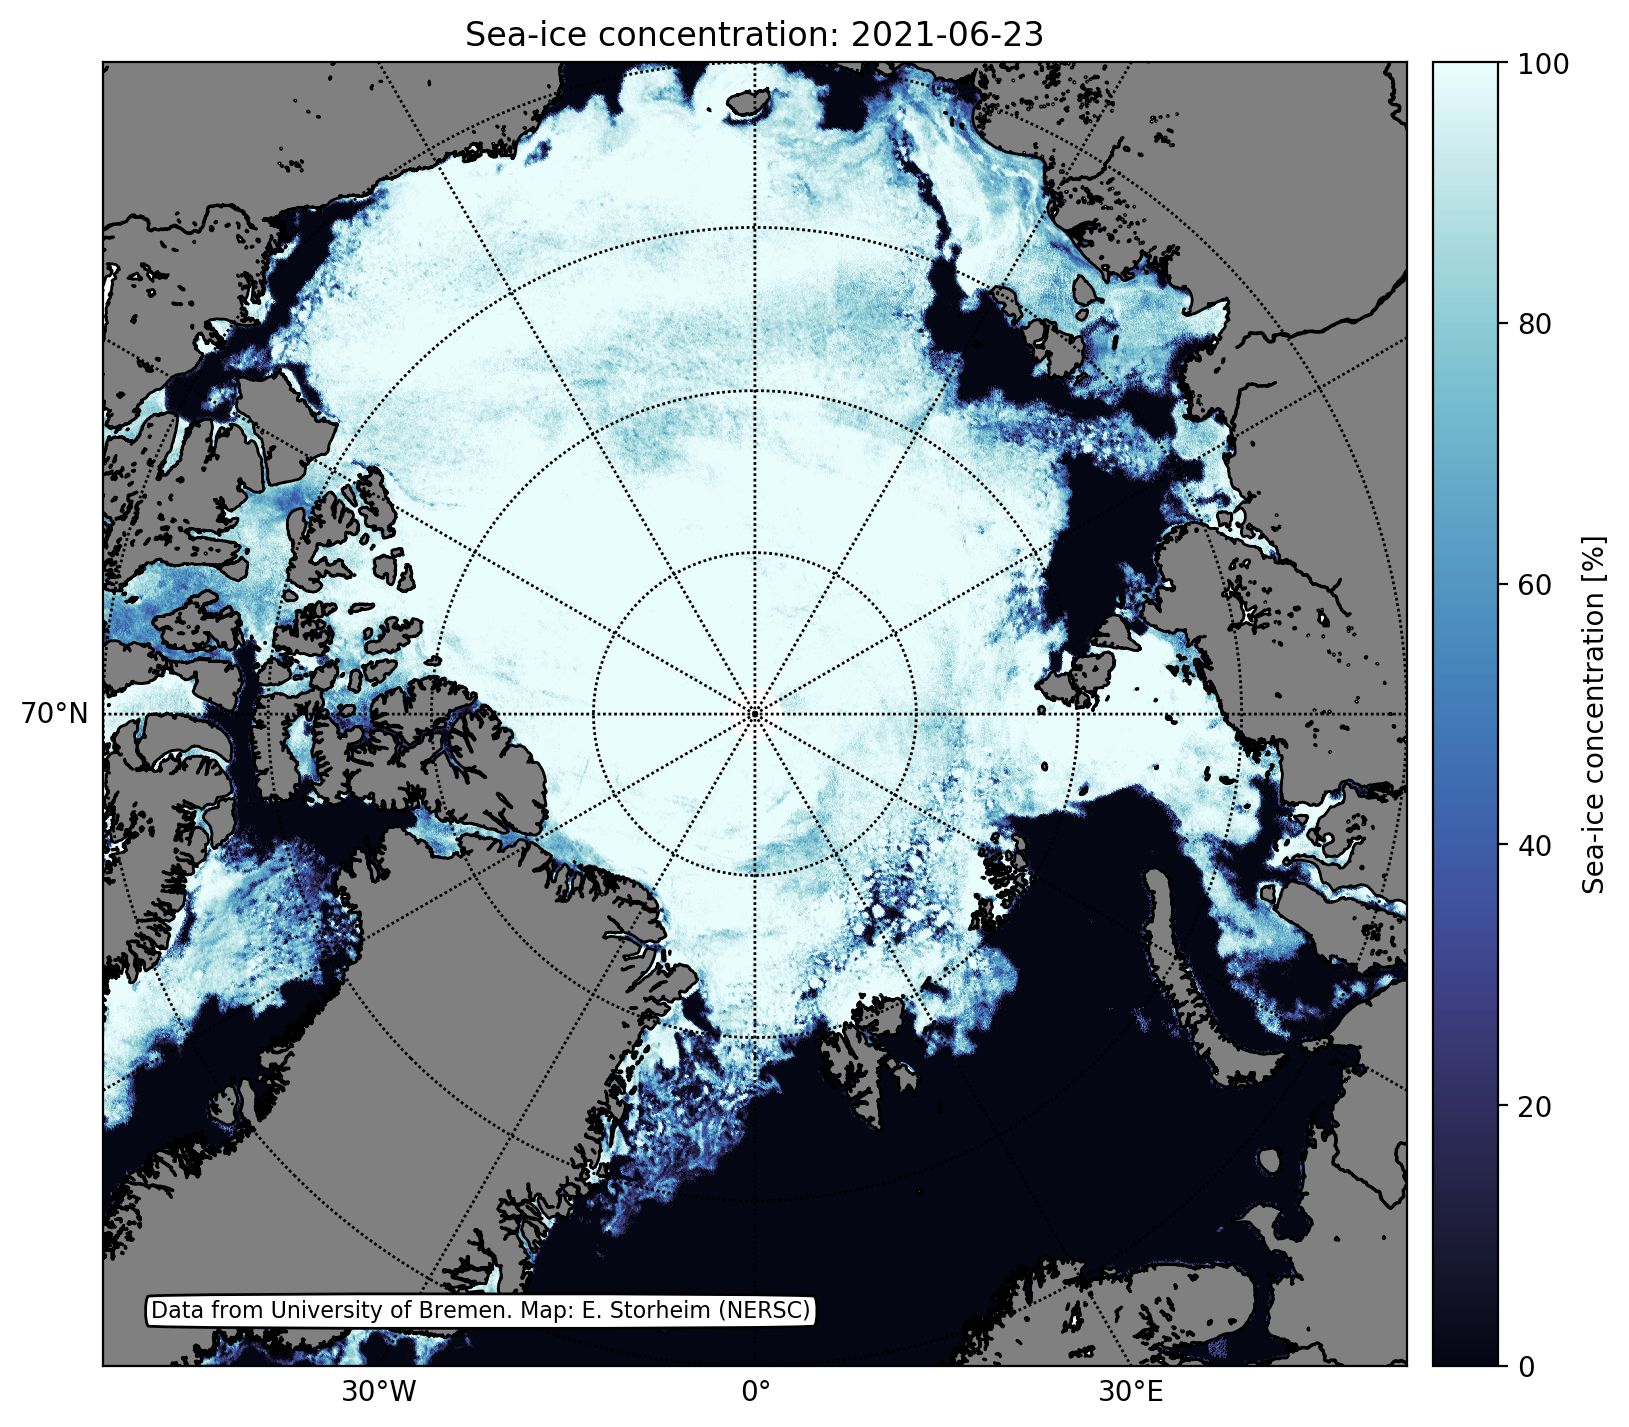
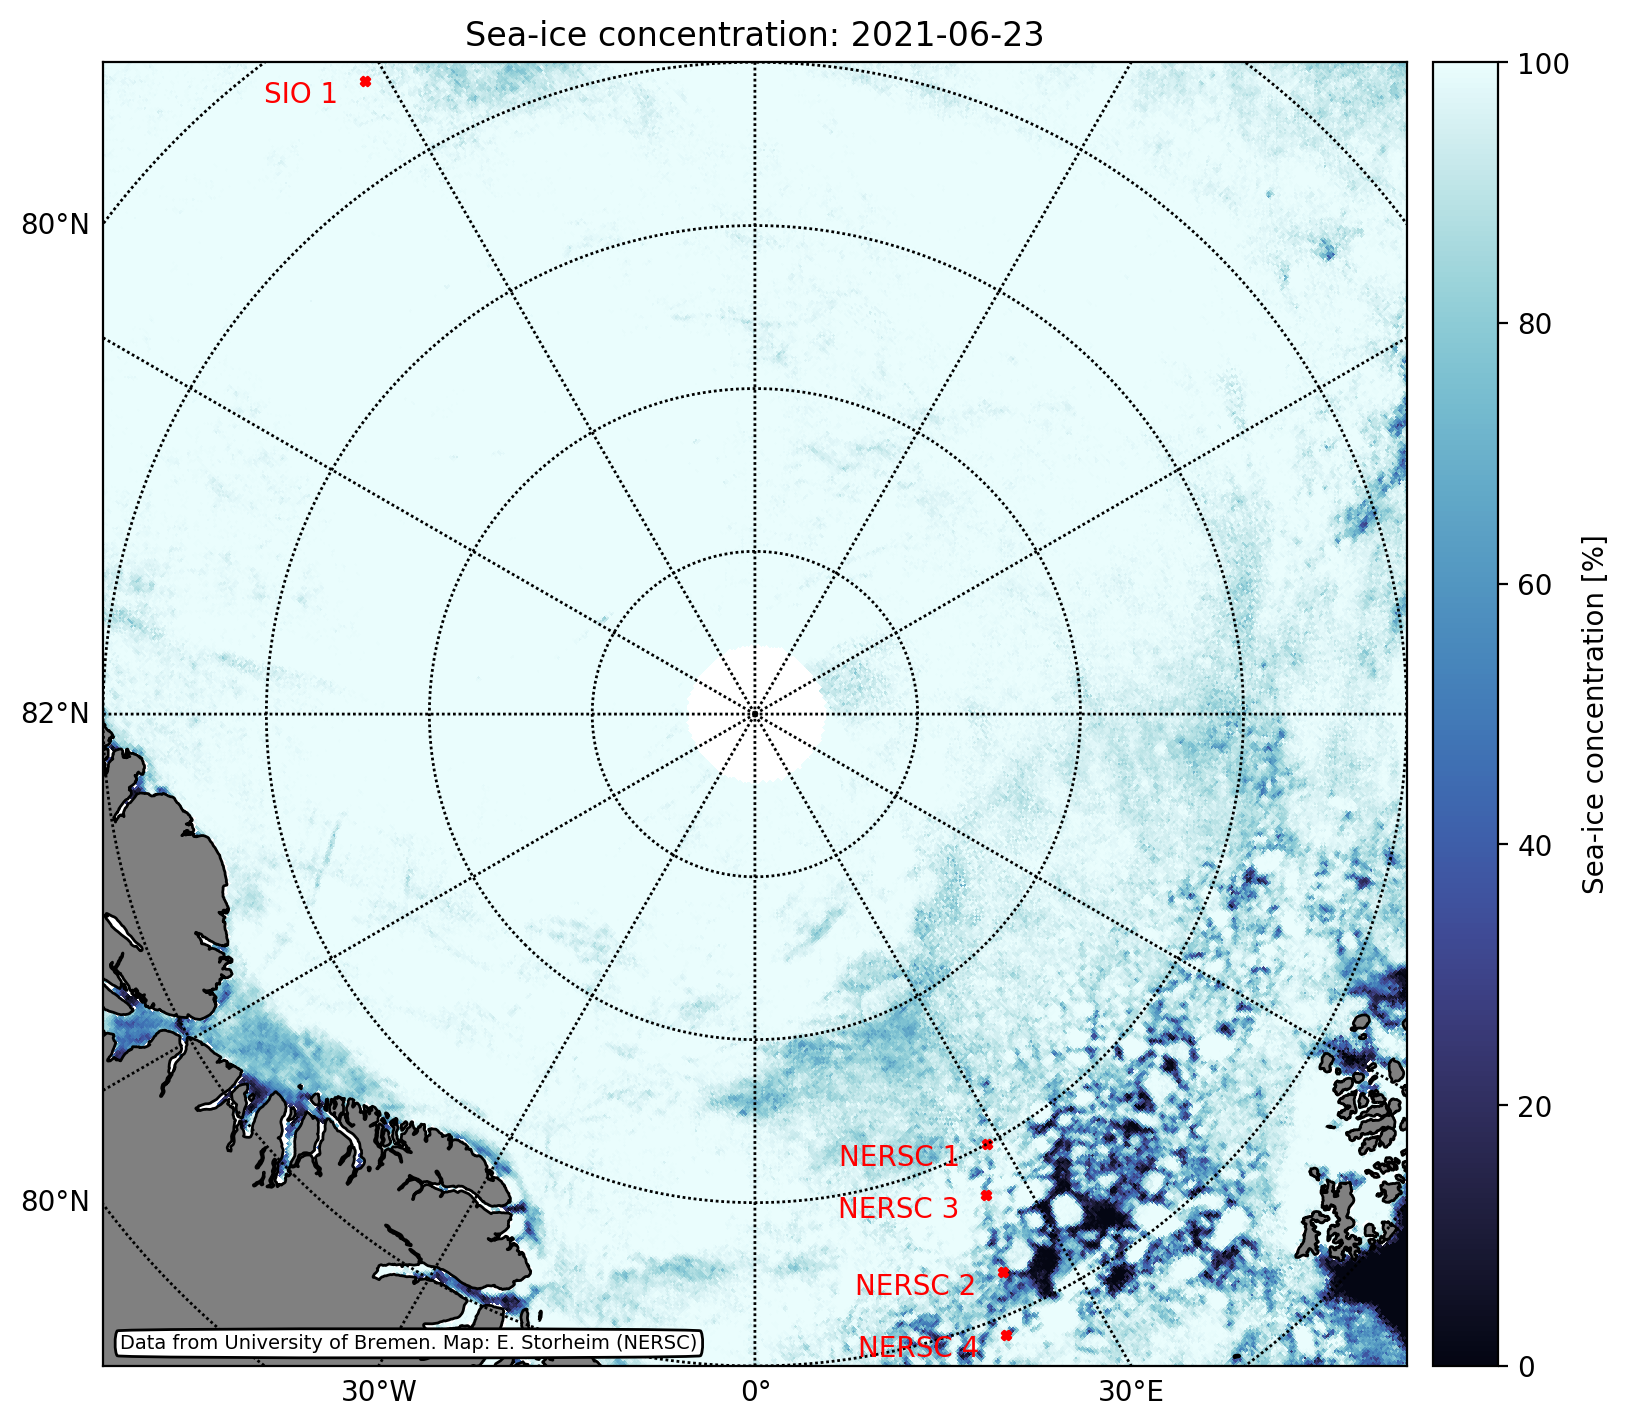
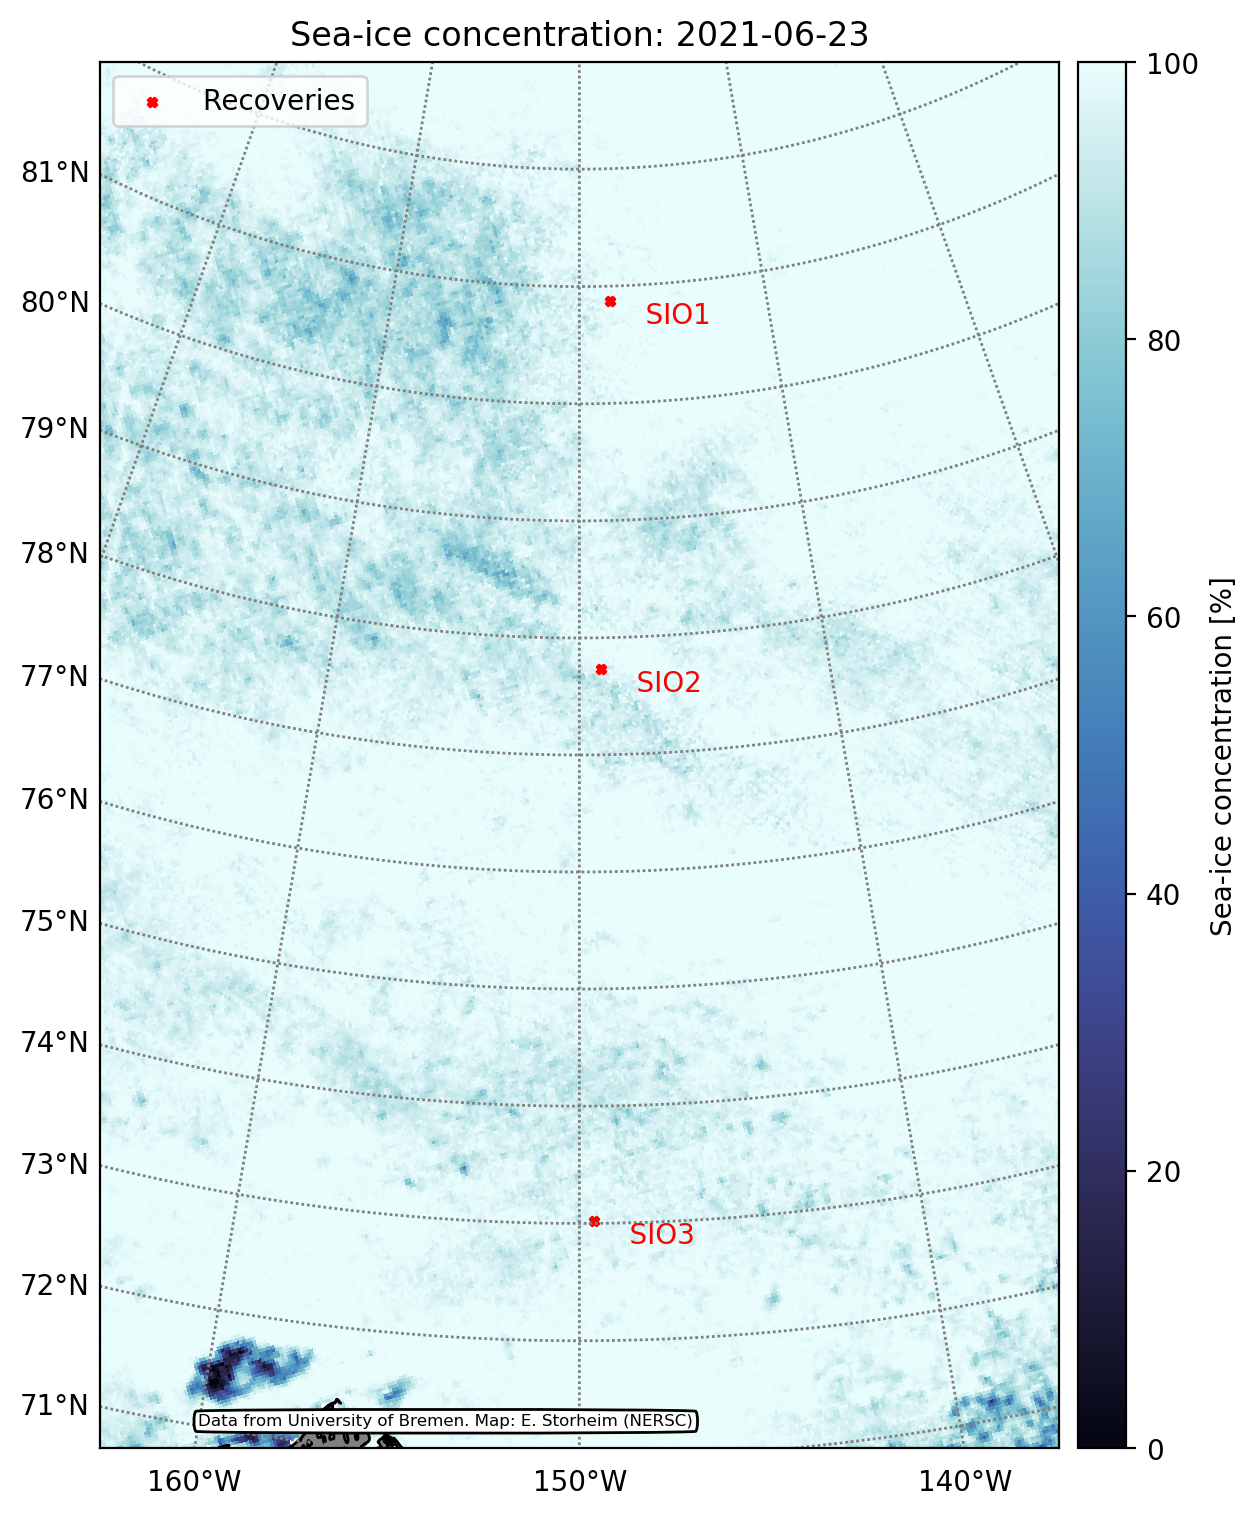
Sea-ice concentration from the AMSR2 dataset provided by the University of Bremen. Source: https://seaice.uni-bremen.de/sea-ice-concentration/
The red markers indicate the locations of the planned mooring locations.
Click here for historical data, with animations.
Click here to watch a comparison video between 2017 and 2019.
Click here to watch animations with buoy data from the International Arctic Buoy Programme (IABP)
Sea-ice products from the Norwegian Meteorological Institute
Sea-ice concentration
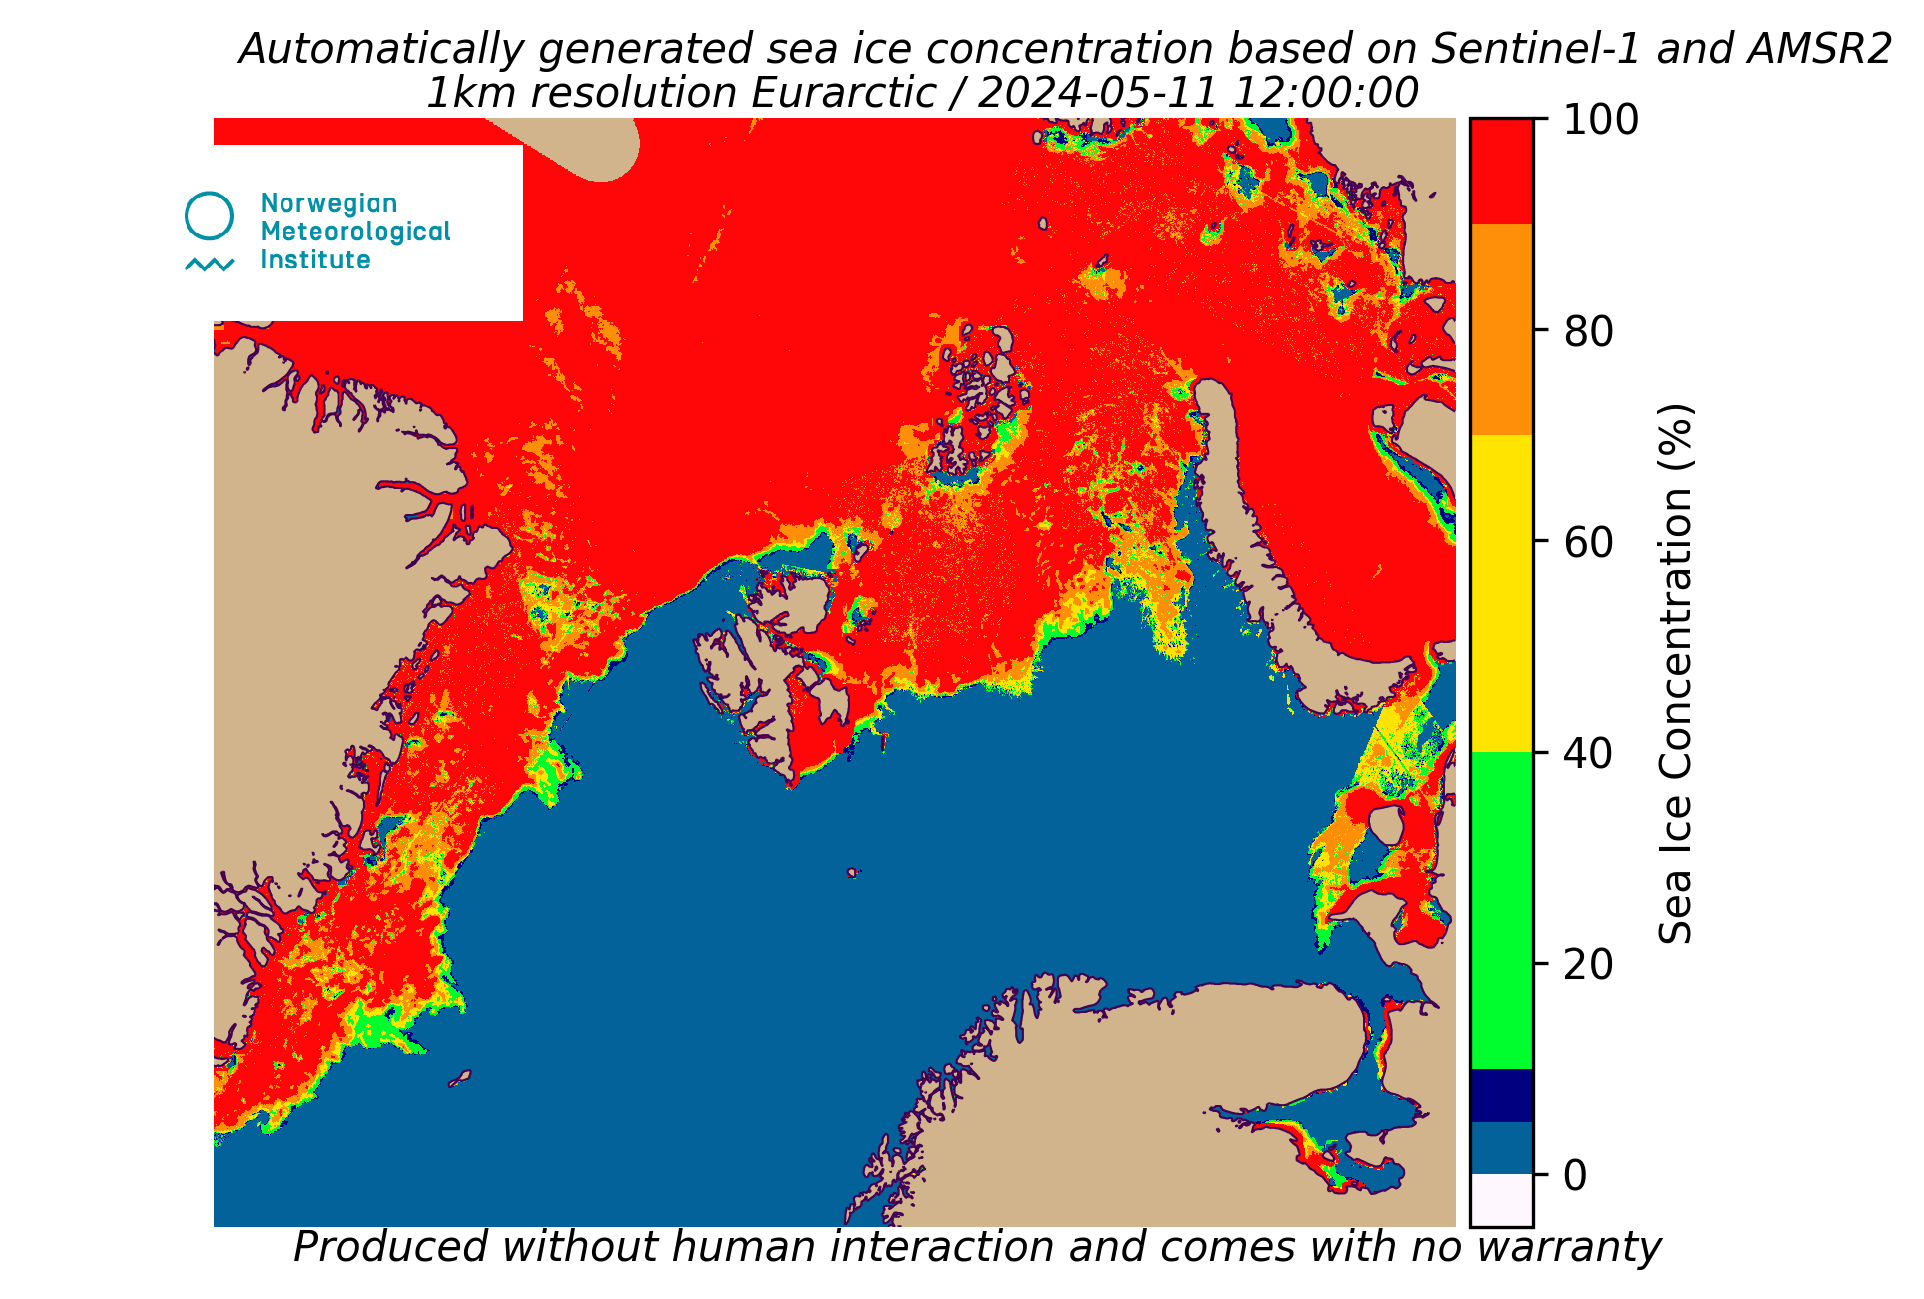
Image obtained from: https://cryo.met.no/sites/cryo.met.no/files/latest/multisensor-conc-latest.png
Mosaic of satellite images
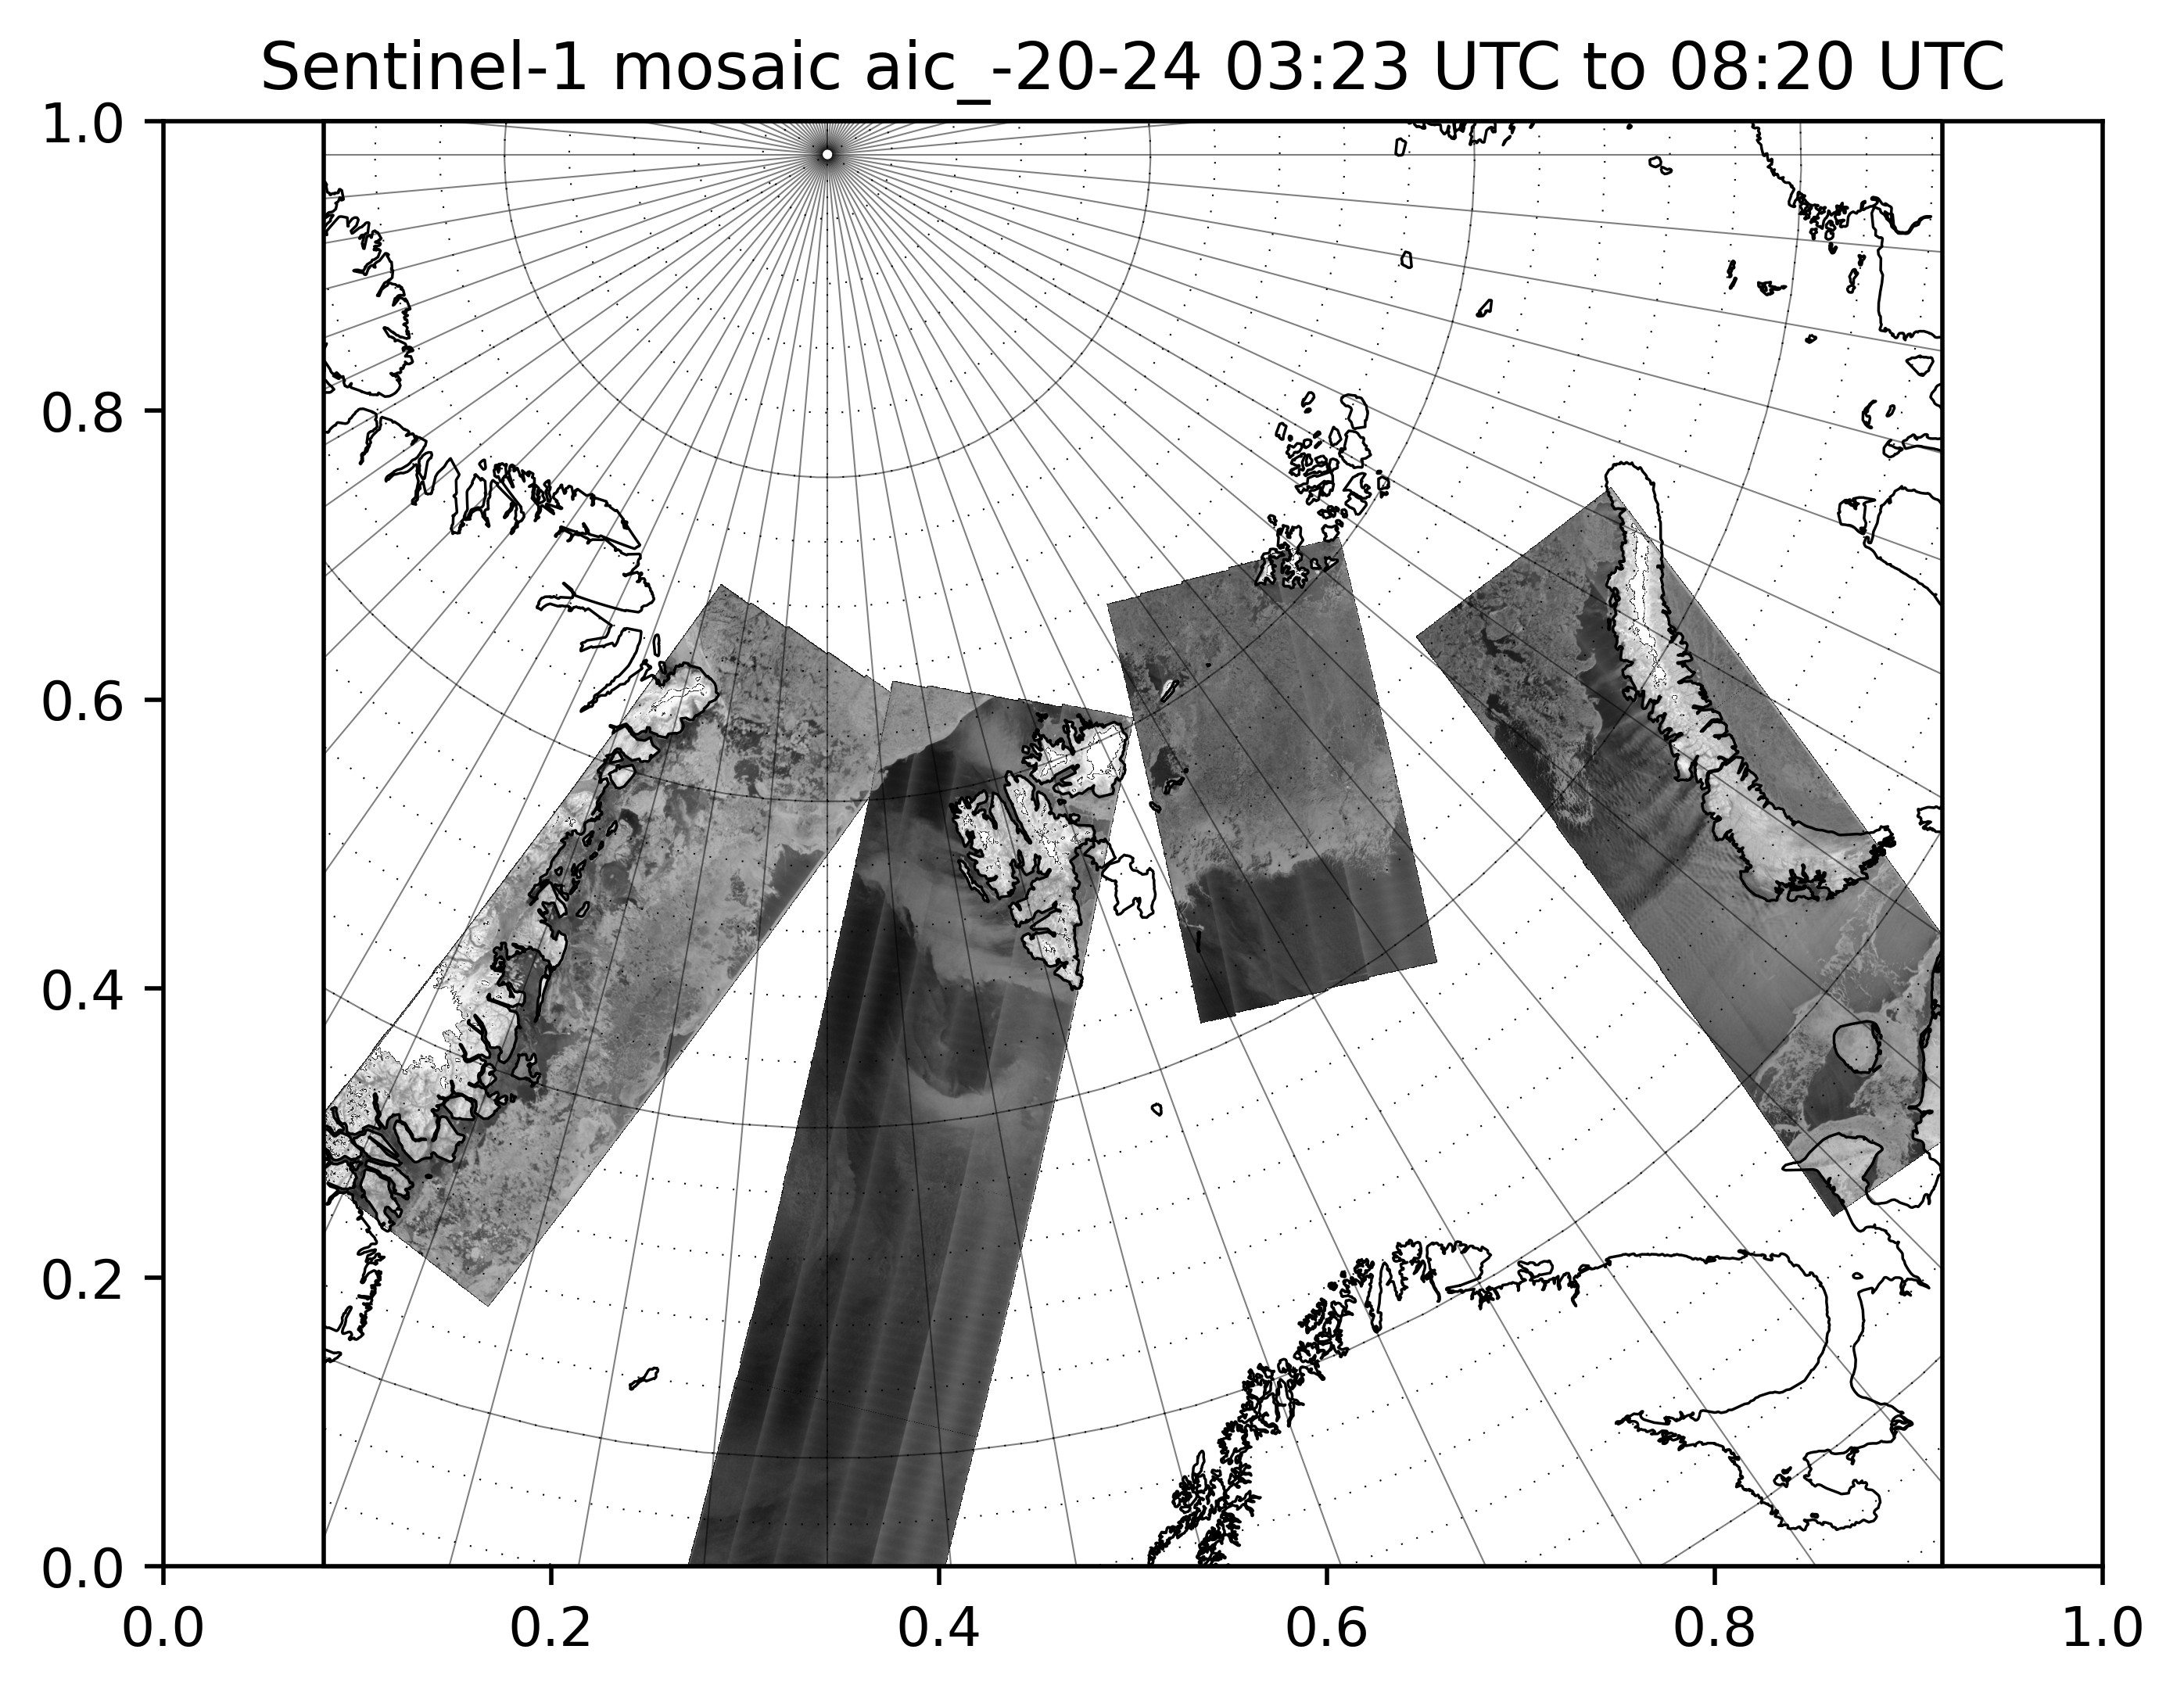
Image obtained from: https://cryo.met.no/sites/cryo.met.no/files/latest/SAR-mosaic-latest.png
Sea-ice drift
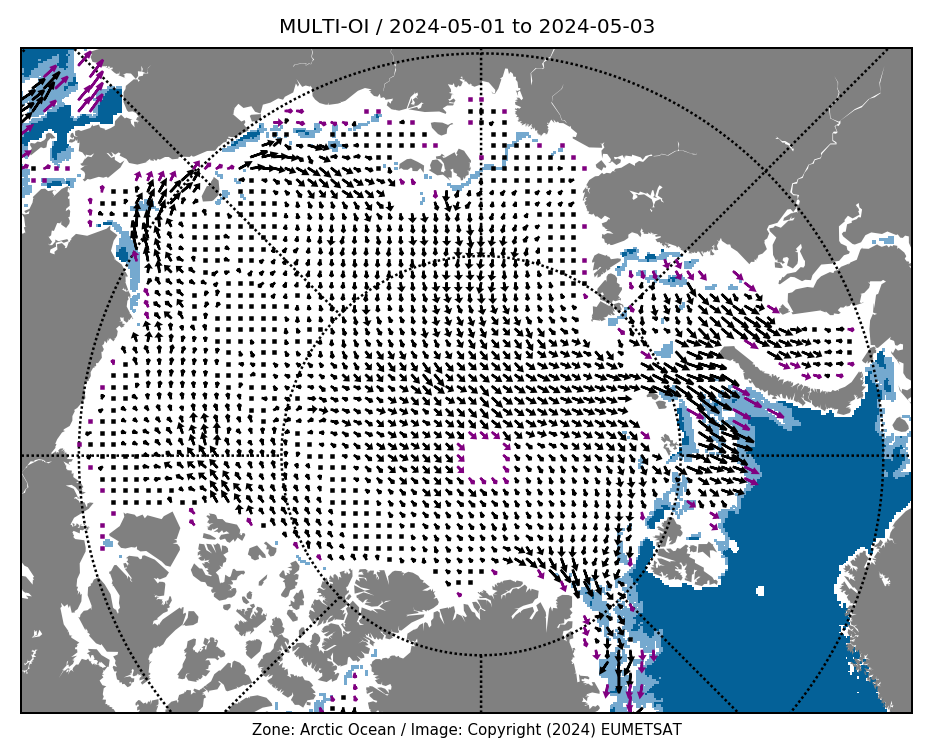
Image obtained from: https://cryo.met.no/sites/cryo.met.no/files/latest/ice_drift_nh_polstere-625_multi-oi_arc_latest.png
Sea-ice products from U.S. National Ice Center
Sea-ice concentration

Image obtained from: https://www.natice.noaa.gov/images/con_arc.png

Image obtained from: https://www.natice.noaa.gov/images/miz_arc.png
Sea-ice primary stage of development

Image obtained from: https://www.natice.noaa.gov/images/sod_arc.png